


Welcome to Now and Again, where I’m returning to subjects I once wrote about regularly. It’s free. Subscribe!
Every four years we hear that a voter in Wyoming carries roughly four times the weight in the electoral college of any single member of the electorate in California. And in every campaign season many of our more analytically oriented election commentators respond that, while this is indeed the case, the bottom-line importance of this state of affairs can be overstated.
All of the above’s pretty much on the money. Perhaps we can flesh out this portion of the quadrennial discussion still further with a bit of measurement and some historical context.
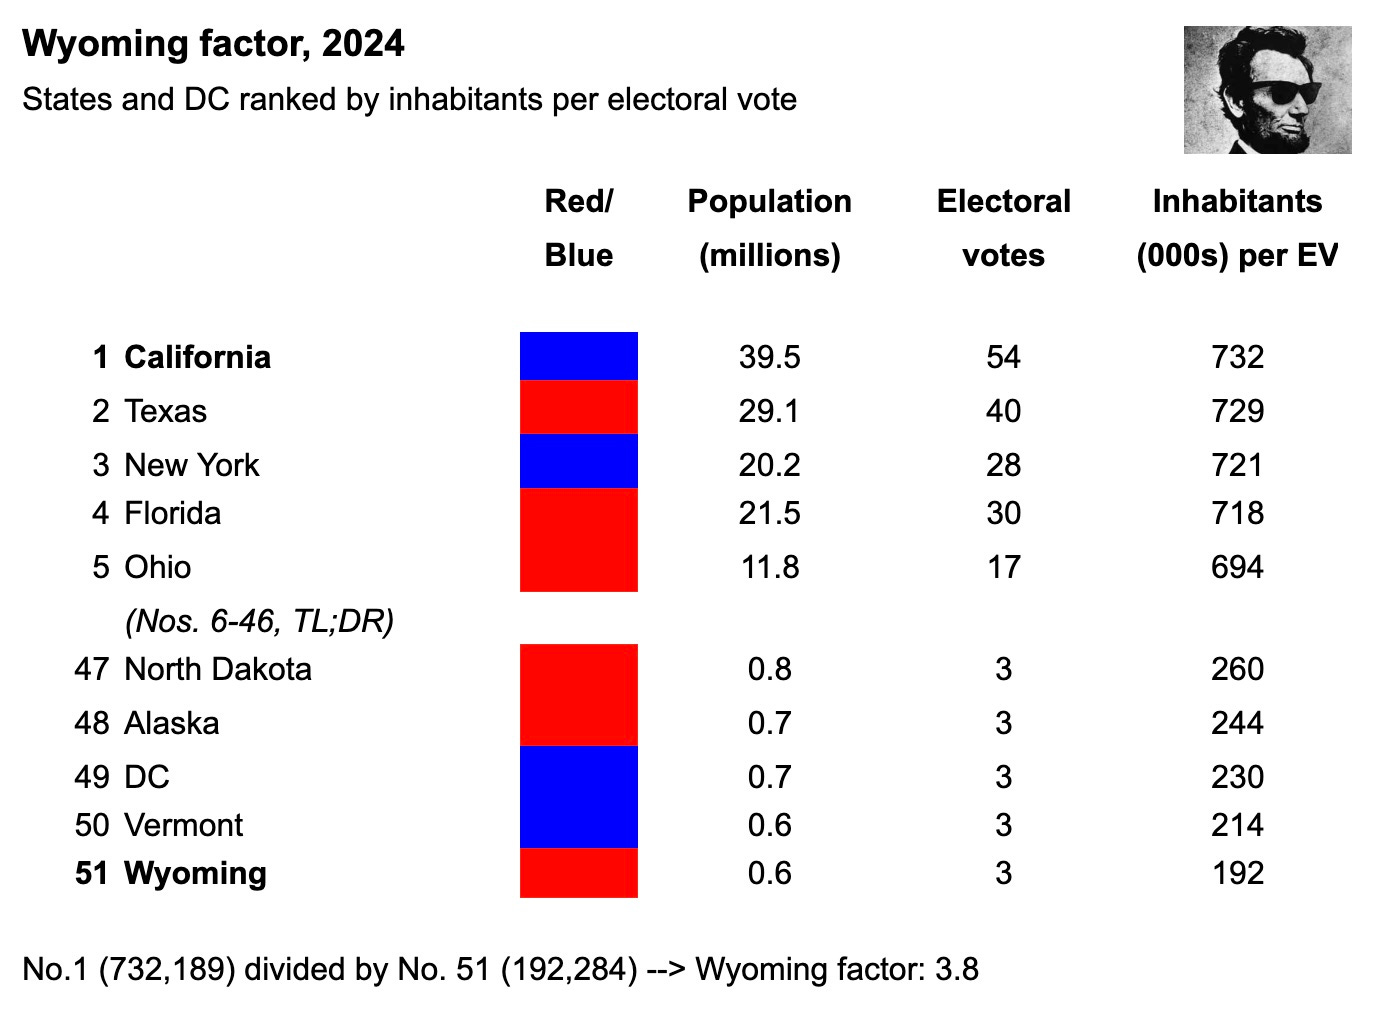
In the upcoming presidential election, each member of Wyoming’s electorate will in fact stroll up to the polling place imbued with 3.8 times the inherent weight on the electoral college that a California voter will possess. Suppose we refer to this ratio as the Wyoming factor until such time as close competitor Vermont catches the Cowboy State.
A Wyoming factor is a measure of geographic imbalance in an electoral college.
At both extremes of electoral college weighting, we see two things. Barring any Dewey-Defeats-Truman-level surprises, there are zero 2024 swing states to be found. Second, and contrary to popular stereotype, we are presented with a rather tidy mix of red and blue states.
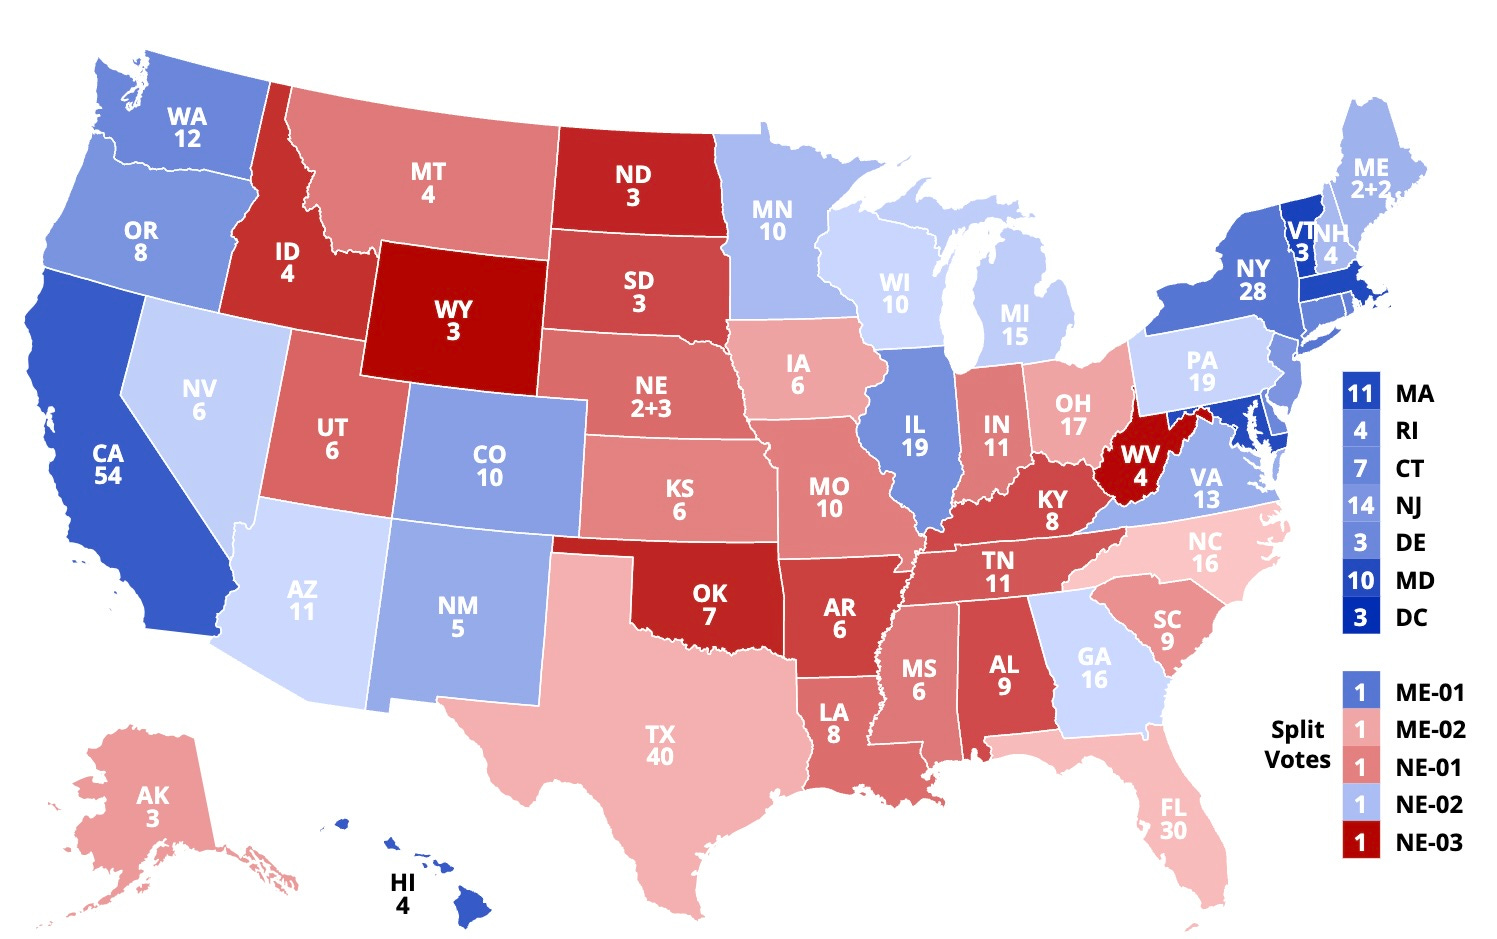
In particular, the actual composition of our table’s bottom rows has on occasion been obscured by pervasive assumptions regarding Wyoming and other spacious but lightly populated rectangular states. The reality is the 12 polities afforded the greatest per-inhabitant structural advantage in the electoral college are: Wyoming, Vermont, DC, Alaska, North Dakota, Montana, Rhode Island, South Dakota, Delaware, Maine, New Hampshire, and Hawaii. (In other words, every state with four electoral votes or fewer except Idaho and West Virginia.) This fortunate dozen is a diverse bunch.
Weighting ballots and allocating electors
Imagine that in some future census Texas knocks California out of the top spot on our table and Vermont does likewise to Wyoming at No. 51. Will attitudes toward the electoral college shift if the most unfairly treated locale of all becomes the Lone Star State? Will said college be faulted as enhancing the pernicious voting power of Vermonters? Even if these particular red-blue valences should change, we’ll still be confronted with individual voters in one state possessing more electoral heft than those in another.
None of which is to minimize the fact that some people do in effect cast 3.8 ballots while others have but one. This state of affairs is far from the “one person, one vote” ideal articulated and in theory guaranteed over the last six decades as the commonsense standard for non-presidential American elections.
There are however not so much mitigating as interdicting factors wreaking their own particular havocs at the presidential level. Our electoral college is nothing if not a haven for distinct varieties of aberrance. In this respect the Wyoming factor does not lack for company.
The greatest aberrance of all can be traced not to varying electoral weights across state lines but rather to the uniformity of the winner-take-all method of allocation outside Maine and Nebraska. Winner-take-all, for example, claims 100 percent of the credit for the electoral inversion in the 2016 presidential election.
If we ran that election again with 538 electoral votes broken down beyond crude whole numbers into precise shares and allocated them perfectly according to population, the result would be effectively identical to what already occurred: Republicans 302.8, Democrats 235.2. The Wyoming factor that obtained at the time (3.6) had zero to do with the outcome.
The relative electoral advantage afforded small states also functions as a mere conditional privilege outside Maine and Nebraska. If you’re like 99 percent of the U.S. population and you inhabit a winner-take-all portion of the map, any privileged small-state ballot will carry enhanced weight only if you happen to vote for the winning candidate in your state.
In 2020, the two major-party candidates received a combined total of 65 million votes from winner-take-all states where they lost. That’s 41 percent of the 2020 electorate, red voters in blue winner-take-all states and blue backers in red ones. Their votes didn’t register in the electoral college. Geographic imbalance isn’t the only factor in play.
Unequal and constitutional
What can today be called the Wyoming factor peaked at an all-time high of 13.2 during the administrations of Theodore Roosevelt and William Howard Taft. At that time the state of New York was growing by leaps and bounds even as pre-gambling Nevada, already the nation’s least populous state, was shrinking.
More recently, the Wyoming factor has stabilized since the reallocation of electoral votes following the census of 1980. For the last 40 years the electoral college’s most-favored state has carried between 3.6 and 3.8 times the weight of the state with the highest number of inhabitants per electoral vote. The former state’s been Wyoming in every presidential election since 1992. The latter has been California since 1984. From 1960 through 1980 this ratio could have been labeled the Alaska factor.
Recall that “one person, one vote” attained the status of a legal standard in a 1963 Supreme Court case that effectively grandfathered in the most prominent exceptions to the rule. The electoral college and the Senate, to say nothing of the Constitution’s amendment process and “one state, one vote” presidential elections thrown to the House of Representatives, are all exempt.
Speaking to all of the above during oral arguments in the 1963 proceedings, one of the justices captured this distinction between electoral theory and federal practice succinctly. “Some people might think this is arbitrary and discriminatory,” Potter Stewart offered, “but it is certainly — there’s no doubt about its constitutionality.”
Though all alike categorically, federal and state-level departures from “one person, one vote” prior to 1963 and the federal ones since then are far from equal statistically. The “fortunate dozen” named above still constitute just 7.6 percent of today’s electoral college. These 12 polities are additionally a mix of red and blue bastions. Their favored-voter privileges thus combine to pull sideways. That’s coincidental and not structural, of course, but for better or worse it’s been a consistent coincidence throughout our 21st-century era of competitive equilibrium in presidential elections.
The electoral college favors small states. Because those small states are and for some time have been a blend of red and blue precincts, the combined impact of this favoritism is mixed as a competitive factor.
Mixed isn’t the same as nonexistent. A straight population-derived electoral college would indeed have yielded a different result in the presidential election of 2000. But in any year close enough for small-state favoritism to come into play there will likely be other exogenous factors that could have swung the election in their own right. Not to mention the electoral college required zero help from any Wyoming factor to produce another inversion in 2016. The small-state bias is real, diffuse, and one among several in our system.