


Blue population centers are seeing red
GOP gains in greater NYC highlight a shift in the nation's most populous counties


Picture yourself looking out at the world from atop the Freedom Tower in Manhattan. Never mind stereotypes about homogeneous coastal elites. The demographics of the adjoining counties actually vary significantly depending on which view you choose.
Levels of educational attainment will fluctuate wildly across your panorama, as will census responses for race and ethnicity. The six adjoining counties you see also elect two different governors across 10 separate congressional districts.
Nevertheless, these counties share one thing in common. All of them just shifted red by double-digit margins, as did deepest-blue Manhattan itself.
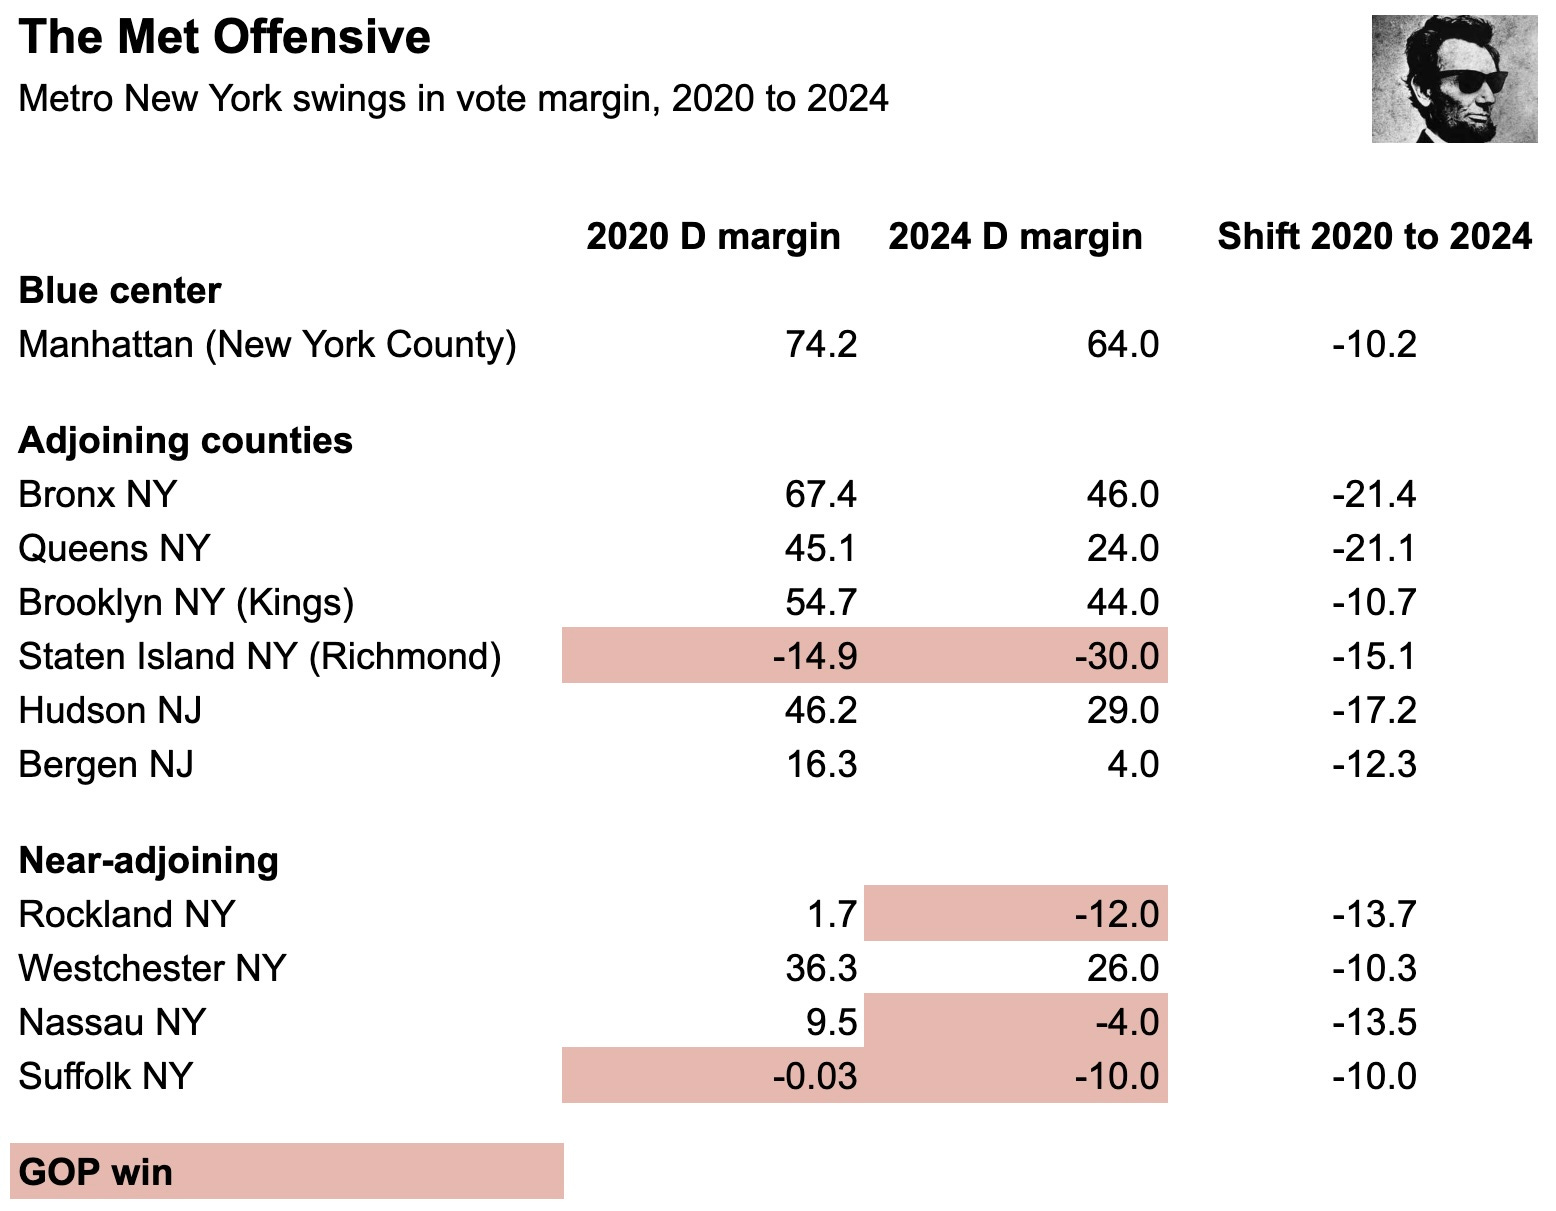
(Figures for 2024 are updated whole-number NYT tallies.)
Could humble geography be having a moment alongside the usual demographic suspects in election analysis? That data’s still being gathered.
Nearly two weeks after Election Day votes continue to be counted in several states, most notably in California. Over the weekend Donald Trump’s popular vote share dropped under 50 percent to 49.9. One estimate suggests his final number could clock in around 49.8, giving Republicans perhaps a 1.5 percent margin of victory in the popular vote. If this is correct it will represent a swing toward the GOP of six percentage points after Joe Biden’s 4.5 percent win over Trump in 2020.
Trump winning nationally by 1.5 percent or so is well within the realm of possibility envisioned by polling in advance of November 5. What’s surprising about that result isn’t necessarily the margin of victory as much as it is the composition of the winning coalition.
In addition to Republican successes in traditionally red states and in exurban and rural areas in blue ones, Trump recorded significant gains in the nation’s largest population centers. The GOP’s improved performance in greater New York City of course wan’t sufficient to flip New Jersey, Connecticut, or the state of New York (much less NYC itself) from blue to red.
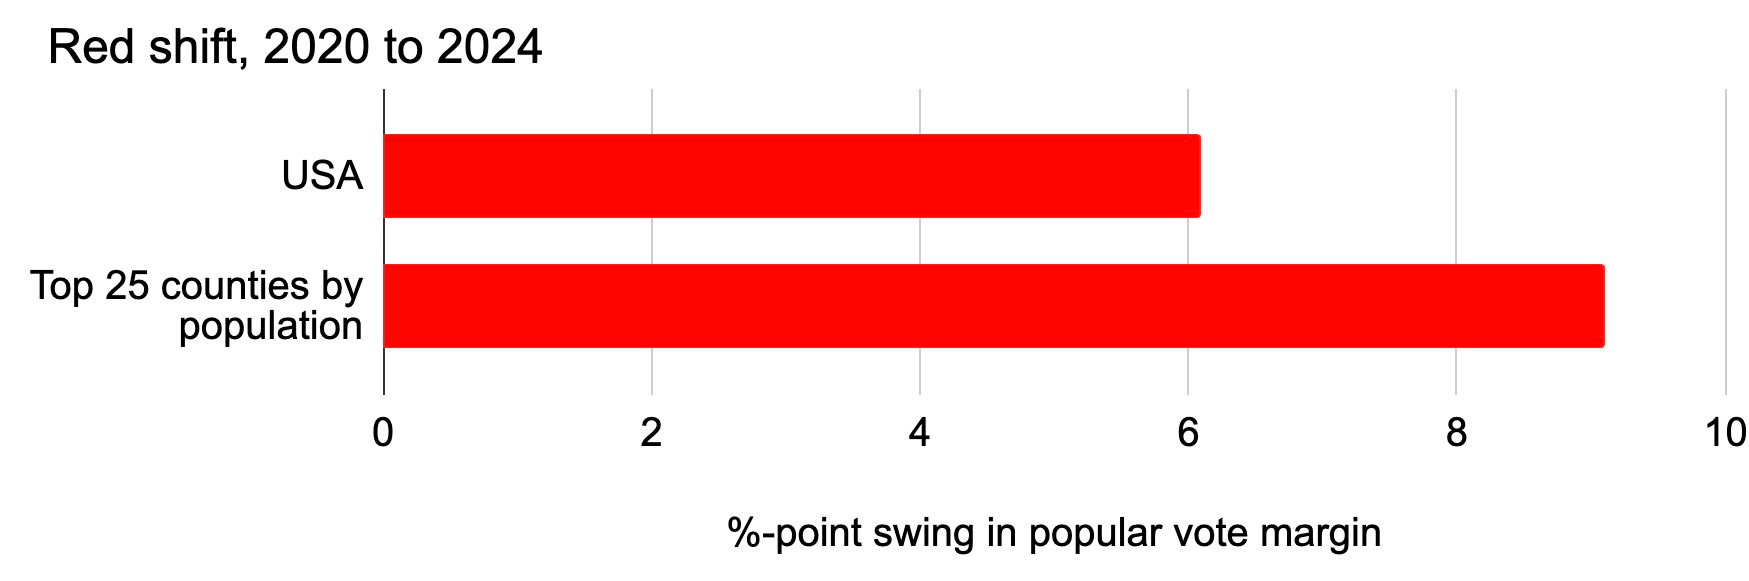
This same shift did however show up in densely populated locales far from the tri-state area. High-population counties like Miami-Dade in Florida and San Bernardino in California followed a path similar to the one navigated in NYC by areas like Queens and the Bronx. Relative to 2020, in fact, the GOP recorded a larger improvement in the country’s top 25 counties by population than the party did in the nation as a whole.
No top-25-population country moved even the tiniest bit in a blue direction compared to 2020. King County, Washington, came the closest by staying the same (D +52.7 in 2020; D +51.4 this month).
This kind of movement in high-population areas is unusual, as demonstrated by what happened the last time the electorate shifted appreciably toward the GOP. In 2012 Mitt Romney improved on John McCain’s losing margin from 2008 by 3.6 percentage points. (Trump in 2016 then narrowed the party’s popular vote deficit by an additional 1.8 percentage points.)
Despite this national trend 12 years ago, our group of 25 high-population counties netted out as perfectly static. In 2012 these counties combined to record a 0.0 percent non-shift, even as the nation as a whole moved almost four percentage points to the right.
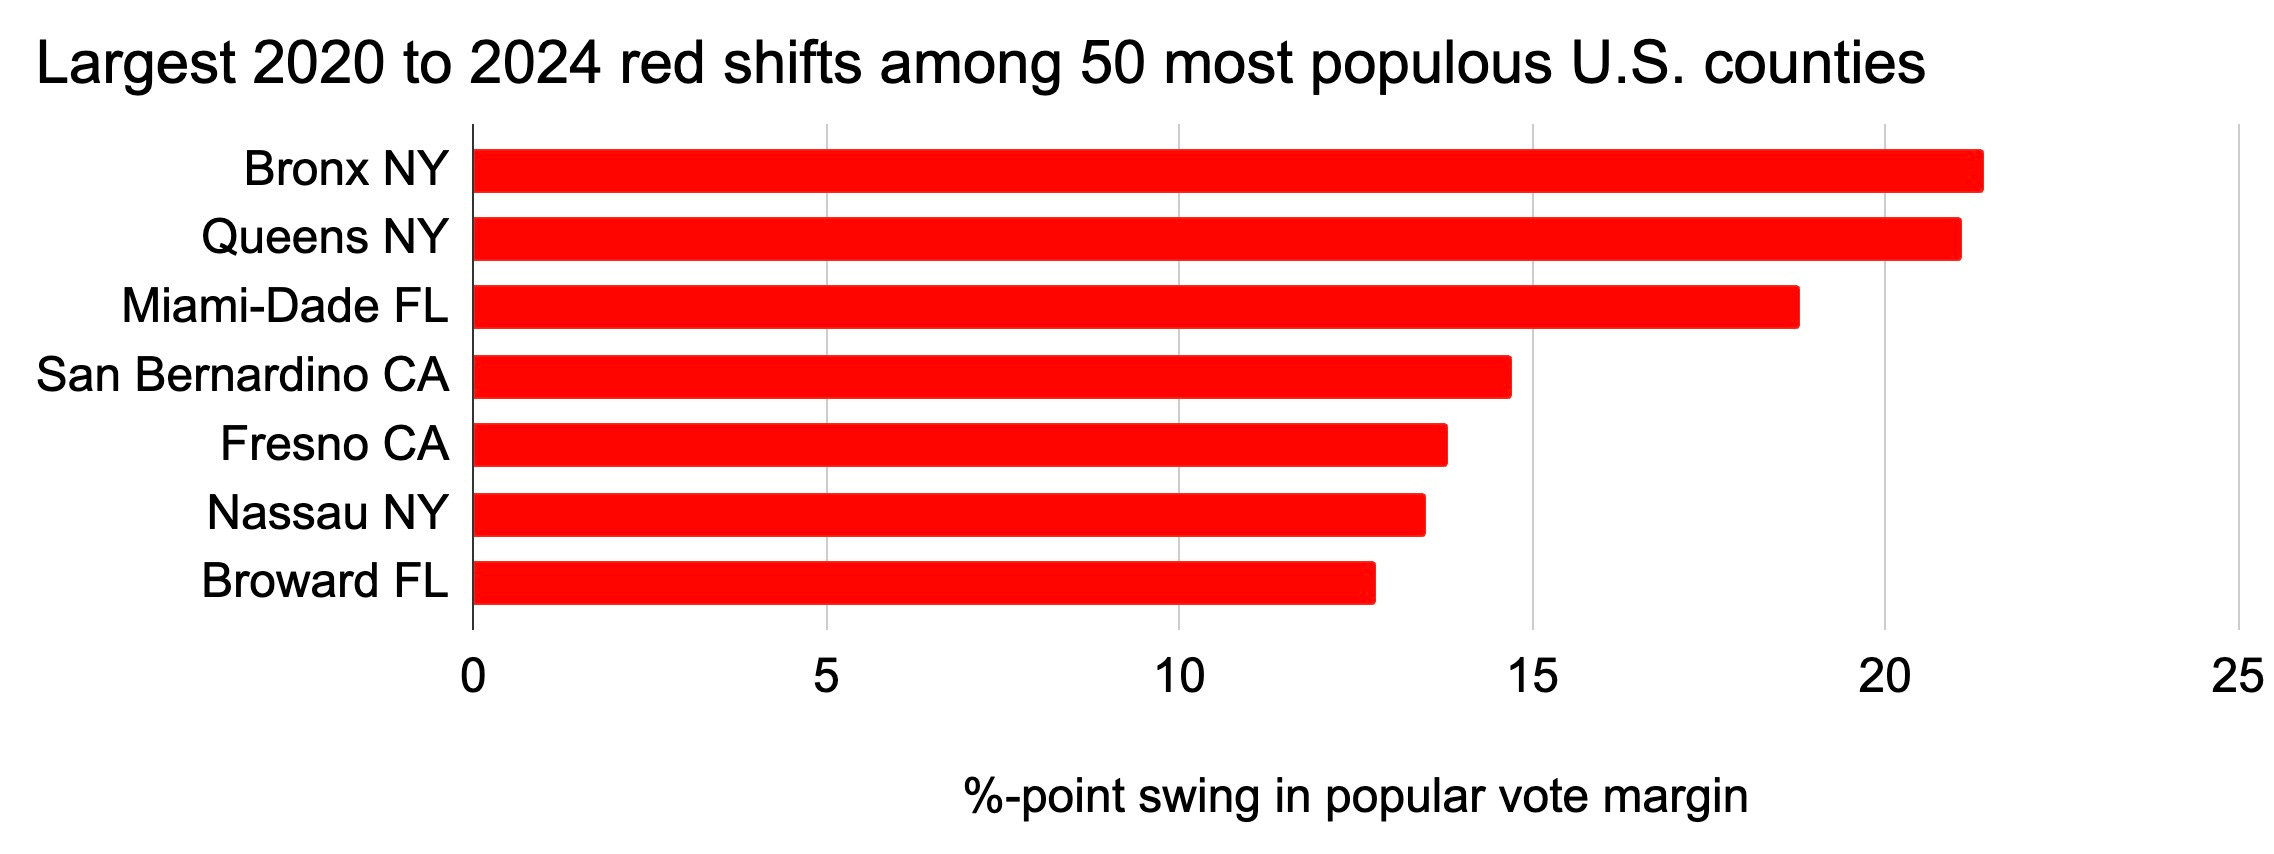
Conversely high-population counties were trend-setters this year. Broadening the focus to the top 50 U.S. counties by population, it’s clear the nation’s most populous areas were far from static in 2024.
These shifts don’t appear to be a rubber-band effect exhibited by deep-blue counties with excess Democratic votes to burn.1 Indeed, these counties aren’t uniformly deep blue — or even blue, period. Trump flipped Long Island’s Nassau County, for example, after losing it by almost 10 points four years ago.
Back in 2020 Trump carried just three of the nation’s top-50 population counties. Republicans that year prevailed in Long Island’s Suffolk County as well as in Collin and Denton Counties in Texas in the rapidly growing region north of Dallas.
This year the GOP won 12 of those 50 counties. The victories were headlined with a win in the nation’s fourth most populous county, Arizona’s Maricopa. Also swinging into the red column this year were: Miami-Dade, Hillsborough, and Duval in Florida; San Bernardino, Riverside, and Fresno in California; Tarrant in Texas; and Nassau in New York.
All but one of these high-population Trump counties are, to be sure, situated within four noncompetitive states: California, Florida, New York, and Texas. Then again Maricopa alone forms a rather significant exception, to say nothing of Clark County in Nevada where Democrats barely hung on for the win.
Nor is “noncompetitive” a static category. Consider Florida. In the last three presidential elections alone, Miami-Dade has undergone something of an electoral metamorphosis. Hillary Clinton won the county by nearly 30 points. Kamala Harris lost it by 11. A 40-point red shift within a decade in a densely populated and diverse coastal locale wasn’t on many bingo cards on election eve 2016.
Naturally Miami-Dade is an extreme example. While a few high-population counties did flip from blue to red, voting behavior nationwide from one election to the next remains largely and indeed overwhelmingly consistent. At the end of the day a 49.8-to-48.3 result nationally or something close to it is par for the course in our era of competitive equilibrium.
Surprising county-level voting shifts situated within far less surprising national totals don’t necessarily herald a new paradigm much less any partisan realignment. Thermostatic reactions may well continue. An incumbent party hasn’t won a presidential election since 2012.
Still, we get just one glimpse of a high-turnout national electorate every four years. One paradox within this set of givens is the electorate’s capacity for significant churn even as it exhibits statistical consistency in bottom-line results from election to election.
While votes are still being counted it appears that this year all 50 states and the District of Columbia have shifted red since 2020. That kind of unanimity didn’t happen even in 2008, when Barack Obama won by more than seven points four years after George W. Bush captured 50.7 percent of the popular vote.
Election results often remake our prior assumptions. One such surprise in 2024 was a notable red shift in the nation’s most populous counties.
The national swing toward Republicans between 2008 and 2012 again offers a useful benchmark. Top-50 population counties recording 2008 Democratic vote shares at least a standard deviation higher (73 percent) than the top-50 population county mean (61 percent) shifted blue in 2012 by an average of 1.9 percentage points. In Queens, for example, President Obama improved on his 2008 performance by more than eight percentage points.